
Introduction
You are looking for ways to increase your binary options strategy performance? Keep on reading to learn how to use the Elliott Wave Theory to find the best trade opportunities for my (or almost any) binary options strategy! One of the most influential and widely used theories in this regard is the Elliott Wave Theory. Developed by Ralph Nelson Elliott in the 1930s, this theory provides a structured framework for analyzing market movements, offering traders insights into future market trends.
Understanding Elliott Wave Theory
The Basic Concept
At its core, the Elliott Wave Theory posits that market prices unfold in specific patterns, which Elliott identified as “waves”. These waves are a reflection of the prevailing investor psychology and external factors influencing the market.
Tip: Click Here And testdrive MotiveWave risk free today!
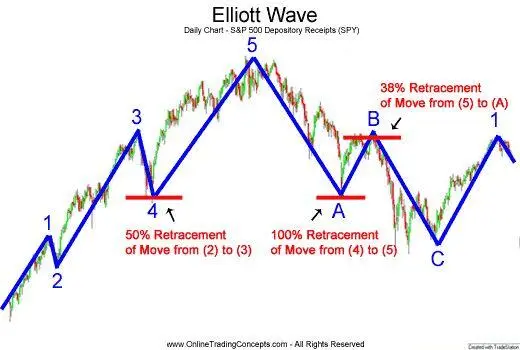
Elliott categorized these waves into two broad types: impulse waves and corrective waves. The impulse waves consist of five sub-waves (labeled as 1, 2, 3, 4, 5) that move in the direction of the main trend, while the corrective waves consist of three sub-waves (labeled as A, B, C) that move against the trend.
Impulse Waves with Fibonacci Ratios
- Wave 1: This wave marks the initial movement in the direction of the trend. It’s often weak and short as the new trend is just starting to establish itself. As it is the start of a new trend, there is no specific Fibonacci ratio associated. It sets the stage for the following waves.
- Wave 2: A corrective wave that typically retraces a portion of Wave 1 but doesn’t extend beyond its start. Typically retraces up to 61.8% of Wave 1. Rarely, it might retrace up to 78.6% in less aggressive trends. If it retraces 100%, its not the second Wave!
- Wave 3: Wave 3 signifies a strong market movement in the direction of the trend. Often the longest and most powerful wave, extending to 161.8% or even 261.8% of Wave 1. It rarely falls short of 100% of Wave 1.
- Wave 4: A corrective wave that is generally more subdued and does commonly retrace between 38.2% and 50% of Wave 3. It should not overlap with the price territory of Wave 1.
- Wave 5: The final wave in the sequence, marking the last surge in the direction of the prevailing trend before a significant reversal or correction. Can extend to 61.8% or 100% of the distance covered from the start of Wave 1 to the end of Wave 3. In some cases, it might extend to 161.8% in strong trending markets.

Corrective Waves with Fibonacci Ratios
- Wave A: Begins the corrective phase with a significant move against the trend. The Fibonacci levels for Wave A are not strictly defined, as it can vary greatly depending on the strength of the preceding trend.
- Wave B: A retracement wave that moves in the direction of the original trend, but doesn’t typically reach the high of Wave 5. Typically retraces up to 50%, 61.8%, or even 78.6% of Wave A. In some rare cases, it might exceed the start of Wave A.
- Wave C: The final wave in the corrective phase, moving sharply against the trend, often extending beyond the end of Wave A. Often travels a distance of 61.8% to 100% of Wave A. In extended corrections, it can reach 161.8% of Wave A.

The Role of Fibonacci Ratios
Elliott discovered that the wave patterns in market prices often align with Fibonacci ratios. These ratios are derived from the Fibonacci sequence, a series of numbers where each number is the sum of the two preceding ones (0, 1, 1, 2, 3, 5, 8, 13, 21, …). The following are the common Fibonacci ratios used in Elliott Wave analysis:
- 61.8% (The Golden Ratio): This is perhaps the most significant Fibonacci ratio, often seen in the retracement of Wave 2 against Wave 1. It’s also common in the relationship between Wave 3 and Wave 1.
- 38.2%: This ratio is frequently observed in Wave 4, where it retraces about 38.2% of Wave 3. It’s a common retracement level for minor pullbacks in a trend.
- 50%: Though not a Fibonacci ratio per se, it’s widely used in financial markets. A 50% retracement of a prior wave is common in corrective waves.
- 23.6%: This is a shallow retracement level, often seen in strong trends where pullbacks are minimal.
- 1.618 (Inverse of 61.8%): Known as the ‘golden ratio,’ this is often observed in the extension of Wave 3, where it can extend to 1.618 times the length of Wave 1.
- 2.618: This extension ratio is less common but can occur in very strong trending markets, particularly in Wave 3 extensions.
- 78.6%: This deeper retracement level is sometimes seen in Wave 2 or Wave 4 retracements, especially in less aggressive trends.
- 161.8%: This ratio is often observed in the targets for Wave 3, where it can be a 161.8% extension of Wave 1.
- 261.8% and 423.6%: These are higher-degree extension ratios, used for projecting potential targets in very strong trends, particularly for Wave 5 or C wave projections.
Understanding and applying these Fibonacci ratios in the context of Elliott Wave Theory can be incredibly useful for traders. They provide potential reversal points and targets for market movements, offering a roadmap for where the price might head next. This insight is particularly valuable in binary options trading, where precise entry and exit points can significantly impact trading success.
Tip: Download my free Binary Options Strategy PDF and learn my proven binary options strategy using a combination of Price Action and technical indicators to determine price movements! It is perfect combined with the Elliott Wave Principle!
How to Use Elliott Wave in Binary Options Trading
Elliott Wave Counting
Using wave counting to find the correct wave pattern for a specific market involves a systematic approach that requires careful observation and analysis of price charts. Firstly, traders should start by identifying the overall trend in the market, determining whether it’s an uptrend or a downtrend. Once the trend is established, the process of wave counting begins.
Traders need to look for clear and distinct wave patterns within the trend, starting with the impulse waves (1, 2, 3, 4, 5) in an uptrend or their counterparts in a downtrend. These waves should exhibit the characteristic progression of higher highs and higher lows in an uptrend and lower highs and lower lows in a downtrend.
Next, traders should focus on the corrective waves (A, B, C) within the trend, looking for patterns like zigzags, flats, or triangles. Corrective waves often display choppier price movements, and they aim to retrace a portion of the preceding impulse wave.
To ensure the accuracy of wave counting, it’s crucial to use multiple time frames and various technical tools such as Fibonacci retracements and extensions. Additionally, comparing the wave structure with volume and other technical indicators can provide further confirmation.
Wave counting can be a nuanced and subjective process, and it may require practice and experience to become proficient. Keeping in mind the potential for wave failure and regularly reviewing and adjusting wave counts as new price data becomes available is essential. By diligently applying wave counting techniques, traders can gain valuable insights into market trends and make more informed trading decisions.
Identifying Entry and Exit Points
By applying Elliott Wave Theory, traders can identify potential entry and exit points. For instance, if a trader identifies the start of Wave 3, which is typically the strongest, they could enter a “call” option in anticipation of a rising market. Conversely, recognizing the start of a corrective phase could signal a good opportunity to enter a “put” option.
Risk Management
Understanding the wave structures also aids in risk management. Traders can set stop-loss orders at points where the wave count would be invalidated, like beyond the start of Wave 1 in a corrective phase, minimizing potential losses.
Time Frame Analysis
Binary options traders can apply the Elliott Wave Theory across different time frames, from intraday to long-term analyses. This flexibility allows traders to adapt their strategies to varying market conditions and time horizons.
Advanced Applications of Elliott Wave Theory
Complex Wave Patterns
While the basic 5-3 wave structure forms the backbone of Elliott Wave analysis, markets often exhibit more complex patterns. These include extended waves, where one of the impulse waves (usually Wave 3) is significantly longer than the others, and diagonal triangles that appear in Wave 5 or C. Recognizing these patterns can provide additional insights into market dynamics and potential turning points.
Combining with Other Technical Indicators
Elliott Wave Theory becomes even more powerful when combined with other technical analysis tools. For instance, using RSI (Relative Strength Index) can help confirm the strength of a wave, while MACD (Moving Average Convergence Divergence) can signal the end of a corrective phase. This multi-dimensional approach to analysis enhances the reliability of predictions.
Real-World Examples
Case Study Analysis
An effective way to understand the application of Elliott Wave Theory is through case studies of past market movements. Analyzing historical data where the wave patterns clearly played out can provide valuable insights into how markets might behave under similar conditions in the future. These case studies not only reinforce the theoretical aspects of the theory but also help in developing a practical approach to trading.
Tip: Apply for a free Motivewave Trial Account for the best tool for Elliott Wave detection … Click here!
Critical Considerations
Subjectivity and Flexibility
One of the most critical aspects to remember about Elliott Wave Theory is its inherent subjectivity. Wave counts are not always clear-cut and can be interpreted differently by different analysts. This subjectivity requires traders to remain flexible in their approach and be prepared to adjust their strategies as new market information unfolds.
Continuous Learning and Practice
Mastering Elliott Wave Theory requires time and practice. Traders should continually educate themselves, stay updated with market trends, and practice wave counting in real-time scenarios. Demo accounts can be a valuable tool for practicing without risking real money.
Limitations and Risks
While Elliott Wave Theory is a powerful tool, it’s not foolproof and should not be the sole basis for trading decisions. Markets can be unpredictable, and external factors like political events or economic news can override technical patterns. Traders should always be aware of these limitations and manage their risks accordingly.
MotiveWave’s Elliott Wave Tools
As we conclude our exploration of the Elliott Wave Rules and their applications in binary options trading, it’s essential to have the right tools at your disposal for effective market analysis. One such invaluable resource is the MotiveWave platform, a comprehensive suite designed specifically for Elliott Wave analysis. MotiveWave offers an intuitive and user-friendly interface, making it easier for traders of all levels to implement complex Elliott Wave strategies.

Key Features of MotiveWave:
- Advanced Charting: MotiveWave provides robust charting capabilities, allowing you to visualize and analyze market trends with precision.
- Customizable Elliott Wave Tools: The platform offers a range of customizable tools for identifying and labeling Elliott Wave patterns, catering to both beginners and experienced traders.
- Fibonacci Tools: To complement your Elliott Wave analysis, MotiveWave includes a suite of Fibonacci tools, crucial for identifying potential retracement and extension levels in wave patterns.
- Strategy Testing: With built-in strategy testing tools, you can validate your Elliott Wave strategies against historical data, refining your approach before applying it in live markets.
- Real-Time Market Scanning: Stay ahead of market movements with MotiveWave’s real-time scanning capabilities, which help in identifying emerging Elliott Wave patterns as they unfold.
- Integration with Multiple Brokers: The platform offers seamless integration with a variety of brokers, making it a versatile tool for traders using different trading platforms.
- Community and Support: Access to a community of fellow Elliott Wave enthusiasts and professional support enhances your learning and trading experience.
Incorporating MotiveWave into your trading toolkit can significantly enhance your ability to analyze and respond to market dynamics using Elliott Wave Theory. Whether you’re a novice or a seasoned trader, MotiveWave’s comprehensive features provide a powerful ally in your pursuit of trading excellence.
Click here and start your free trial today!
By leveraging tools like MotiveWave and staying updated with the latest market analysis techniques, you can refine your trading strategies and increase your chances of success in the ever-evolving world of binary options trading.
Conclusion
The Elliott Wave Theory offers a comprehensive framework for understanding market trends and making informed trading decisions in the binary options market. By combining wave analysis with other technical tools and maintaining a flexible approach, traders can significantly enhance their ability to predict market movements. However, like any analytical tool, it requires practice, continuous learning, and a balanced view of its capabilities and limitations. With these considerations in mind, traders can effectively utilize the Elliott Wave Theory to improve their trading strategies and increase their chances of success in the dynamic world of binary options trading.
