Introduction to Trend Trading in Binary Options
Welcome to the dynamic world of binary options trading on ExpertOption! If you’re aiming to enhance your trading effectiveness, understanding trend trading is crucial.
This ExpertOption Trading Strategy is not just about identifying which way the market is moving; it’s about making strategic decisions that align with that direction.
In this guide, we’ll take a look into the mechanics of trend trading using price action and indicators, tailored specifically for the Expert Option platform.
While other platforms offer more indicator and drawing options, this binary opptions strategy is created specially for the limited options Expertoption has to offer!
Expert Option Trading Strategy Video
Understanding Price Action
What is Price Action?
Price action is the analysis of a security’s price movements, observed through graphical representations such as line or candlestick charts. It focuses on the intrinsic patterns that emerge from the fluctuating prices, primarily over short time periods. By studying these patterns, traders can interpret the market’s sentiment and make informed trading decisions without relying on external indicators. This method is pivotal for identifying potential entry and exit points based on the direct data provided by market prices themselves, making it a fundamental technique for technical analysis in trading.
Interpreting Chart Patterns
On ExpertOption, various chart types can be used to analyze price action. Each type offers unique insights, but candlestick charts are particularly valuable due to the depth of information they provide. Here’s how to interpret some basic candlestick patterns:
- Bullish Engulfing: This pattern occurs when a small bearish candle is followed by a larger bullish candle that completely engulfs the first. It signals a potential reversal from bearish to bullish, suggesting a buying opportunity.
- Bearish Engulfing: The opposite of bullish engulfing, this pattern indicates a shift from bullish to bearish sentiment and could be a signal to sell.
- Doji: A candle where the open and close are nearly the same. It reflects indecision in the market, often marking a potential reversal or continuation, depending on preceding candles.
Understanding these patterns helps traders on Expert Option anticipate potential market movements without relying solely on indicators.
Key Indicators for Trend Trading Strategies
To complement your price action analysis, incorporating indicators can help confirm trends and enhance decision-making. Here are three essential indicators to consider on ExpertOption:
- Moving Averages (Simple and Exponential)
- Purpose: Smooths price data to create a single flowing line, making it easier to identify the direction of the trend.
- Application: Use a simple moving average (SMA) for a broader view of the trend over time. An exponential moving average (EMA) gives more weight to recent prices, which can be useful for catching trends early.
- Relative Strength Index (RSI)
- Purpose: Measures the speed and change of price movements. An RSI level above 70 indicates overbought conditions, while below 30 suggests oversold conditions.
- Application: Use RSI to identify potential reversals. For instance, if the RSI is above 70 and begins to decline, consider this a sell signal as the market could be turning bearish.
- Moving Average Convergence Divergence (MACD)
- Purpose: Shows the relationship between two moving averages of a price. MACD is great for spotting changes in the strength, direction, momentum, and duration of a trend.
- Application: When the MACD crosses above its signal line, the indicator is bullish, suggesting that it may be time to buy. A cross below the signal line might be a cue to sell.


These indicators are readily available on ExpertOption and can be easily added to your charts, providing a robust framework to support your price action analysis.
Combining Price Action with Indicators
Integrating price action and indicators can significantly refine your trading strategy on ExpertOption. This combination allows you to confirm trends spotted through raw price movements with statistical data provided by indicators, minimizing false signals and increasing trading accuracy.
Strategies for Integration
- Trend Confirmation: Use moving averages to confirm the trends identified through candlestick patterns. For example, if a bullish engulfing pattern coincides with a price that is above a rising moving average, it reinforces the likelihood of a continuing uptrend.
- Momentum Checks: Before making a trade decision based on a candlestick pattern like a ‘Doji’, check the RSI for overbought or oversold conditions. If a Doji appears when the market is neither overbought nor oversold, it might signal a stronger potential for market direction change.
- MACD Convergence: Look for instances where price action (such as reaching new highs or lows) is not confirmed by the MACD. This divergence can often predict potential price reversals, providing a strategic entry or exit point.
Case Studies on ExpertOption
- Case Study 1: Analyzing a Bullish Trend
- Scenario: The price shows a series of higher highs and higher lows on the candlestick chart.
- Action: Confirm with a 50-period EMA and MACD. If the price is above the EMA and the MACD line crosses above the signal line, consider a long position.
- Case Study 2: Identifying a Bearish Reversal
- Scenario: A bearish engulfing pattern appears at a resistance level.
- Action: Check the RSI for overbought conditions. If RSI is above 70 and starts declining, and MACD shows a crossover below the signal line, consider taking a short position.
My Expertoption Trading Strategy In Detail
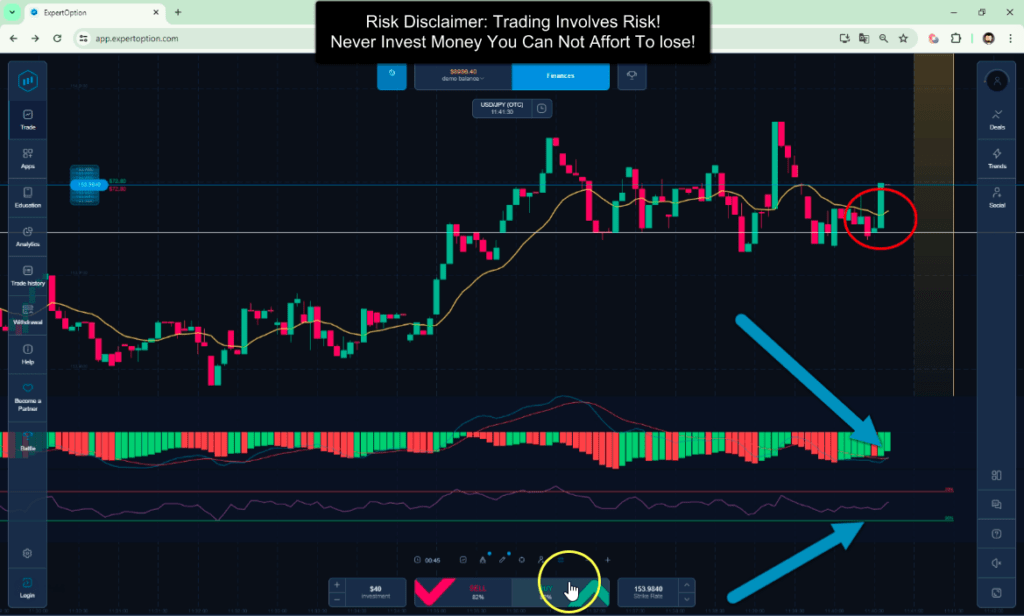
This strategy combines the Moving Average Convergence Divergence (MACD) and the Relative Strength Index (RSI) to establish clear entry points for both call and put options on ExpertOption. It’s designed for use with timeframes where the expiration time is ideally set to 3 to 5 times the length of the chart timeframe, ensuring enough room for the trade to mature.
Strategy Setup
- Indicators to Use:
- MACD: Set the standard parameters (12, 26, 9) to identify the momentum and direction of the trend.
- RSI: Set to a 14-period to measure the speed and change of price movements, identifying overbought and oversold conditions.
- Chart Timeframe: Choose a chart timeframe that suits your trading style. For demonstration, we’ll use a 15-minute chart.
Identifying Entry Points
- For a Call Option (Going Long):
- MACD Criteria: Look for the MACD line to cross above the signal line, indicating a potential bullish reversal or the strengthening of an existing bullish trend.
- RSI Criteria: Ensure the RSI is below 70 to avoid entering during overbought conditions. Ideally, the RSI should be rising from below 30 towards 50, signaling increasing bullish momentum.
- Entry Point: Enter a call option when both the MACD line crosses above the signal line and the RSI is ascending and under 70 after recently being oversold.
- For a Put Option (Going Short):
- MACD Criteria: Look for the MACD line to cross below the signal line, indicating a potential bearish reversal or the strengthening of an existing bearish trend.
- RSI Criteria: Ensure the RSI is above 30 to avoid entering during oversold conditions. Ideally, the RSI should be falling from above 70 towards 50, signaling increasing bearish momentum.
- Entry Point: Enter a put option when both the MACD line crosses below the signal line and the RSI is descending and above 30 after recently being overbought.

Choosing Expiration Time
To choose the perfect expiration time for binary options i recommend 3 to 5 times the length of your selected chart timeframe. For a 15-minute chart, this would mean an expiration time ranging from 45 minutes to 1 hour and 15 minutes. This range helps to buffer against minor price fluctuations and allows the trade enough time to develop within the expected trend direction. Overall, this always depends on the strategy and the market situation!
Practical Example
Suppose you’re using a 15-minute chart, and you observe the MACD line crossing above the signal line while the RSI starts to rise from 30 towards 50. This is your cue to consider a call option with an expiration time of about 45 minutes to 1 hour and 15 minutes. This setup uses the synergy between MACD and RSI to catch the trend early while avoiding false signals commonly seen in volatile markets.
Strategy Tips
- Always confirm the trend with price action; look for supporting patterns like bullish engulfing or higher lows in call entries, and bearish engulfing or lower highs in put entries.
- Utilize the free demo account on ExpertOption to practice this strategy without risking real money, allowing you to refine your approach based on real market conditions.
Money Management in Trading
Effective money management is crucial for sustained success in trading on ExpertOption. Here are key strategies to consider:
Martingale System: This aggressive strategy involves doubling your trade size after a loss to recover previous losses with the next winning trade. While it can quickly compensate for losses, it also risks significant capital depletion after consecutive losses and is suitable for traders with large capital reserves and high risk tolerance.
Fixed Amount Investments: A safer and recommended approach is investing a fixed amount or a consistent percentage of your total capital in each trade. This method protects your capital by preventing disproportionate losses on a single trade.
Capital Allocation Rule: Never risk more than 5% of your overall capital on a single position. This rule helps preserve your trading funds, allowing for recovery from losses and ensuring long-term trading viability.
Adopting these money management techniques will help maintain a balanced risk across your trades and promote financial stability in your trading activities.
Practical Trading Tips
To maximize the effectiveness of trend trading strategies on Expert Option, consider the following practical tips:
- Money Management: Always decide on your risk level before entering a trade. A common practice is to risk no more than 2% of your account balance on a single trade. This helps preserve your capital against market volatility.
- Economic News Influence: Stay informed about key economic announcements, as they can significantly impact market trends. Use the economic calendar on ExpertOption to plan your trading activities around major economic releases like GDP announcements, interest rate decisions, or employment data.
- Utilize the Demo Account: ExpertOption offers a demo account with virtual funds. Use this feature to practice your strategies without financial risk, allowing you to experiment with different combinations of price action and indicators until you find the most effective mix.
- Continuous Learning: The financial markets are always evolving. Keep updating your knowledge and trading skills by exploring new strategies, attending webinars, and following market analysts on ExpertOption.
Alternatives to Expert Option
As I already told you inside my trading strategy video here on this page (Its worth watching), I do not really use Expert Option myself for s handful reasons (Anyway, the trustpilot rating looks ok)! One is the limited number of tools to analyze charts, another is the Charts changing the timeframe without getting asked to do so! SO I recommend choosing one of these brokers instead:
Quotex – This is my number one broker for binary options where I trade normally! It provides a lot of features, good and fast charts, lots of indicator and drawing tools, social trading and much more, it is really worth a look!
OlympTrade – Another good broker also providing Forex Trading. OlympTrade also offers lots of tools and features making it worth a look!
Conclusion
Combining price action and indicators offers a powerful approach to trend trading on Expert Option. By using these strategies, you can make more informed decisions that align with market movements, manage your risks effectively, and increase your potential for profitable trades.
Remember, success in trading comes from consistent practice, ongoing learning, and disciplined money management. this broker provides all the tools you need to embark on your trading journey; it’s up to you to make the most of them.
Frequently Asked Questions (FAQs) on Trend Trading with ExpertOption
What is the best indicator to use for trend trading on ExpertOption?
The “best” indicator can vary based on your trading style and the specific market conditions. However, Moving Averages (MA) and the Moving Average Convergence Divergence (MACD) are particularly useful for identifying and confirming trends. MAs help smooth out price data to identify the direction of the trend, while MACD provides insights into the strength and momentum of the trend.
How do I decide which time frame to use for trend trading?
Choosing a time frame should depend on your trading strategy and how long you intend to hold your positions. For short-term trading, such as day trading, you might use time frames like 1-minute, 5-minute, or 15-minute charts. For longer-term trend trading, 1-hour, 4-hour, or daily charts can be more beneficial as they smooth out minor fluctuations and provide a clearer view of the trend.
Can price action strategies work for all types of assets on ExpertOption?
Yes, price action strategies are versatile and can be applied to various asset types available on ExpertOption, including stocks, forex, commodities, and cryptocurrencies. The key is understanding the unique characteristics of each asset and adjusting your strategy accordingly. For instance, forex markets might require closer attention to international news and events, while stock trading can be more influenced by company-specific news.
How important is risk management in trend trading?
Risk management is crucial in trend trading as it helps protect your capital against unfavorable market moves. Always set stop-loss orders to limit potential losses. Additionally, manage your trade sizes to avoid overexposure in a single trade. Remember, preserving capital is just as important as making profits.
Is it possible to combine multiple indicators for better results?
Absolutely, combining multiple indicators can enhance your trading strategy by confirming the signals provided by each. For example, using RSI with MACD can help confirm both the momentum and the potential reversal points. However, be cautious of overloading your charts with too many indicators as it can lead to conflicting signals and confusion. Stick to 2-3 key indicators to maintain clarity in your trading decisions.
